
FrostHeatDamageFunctions calculates daily and cumulative yield reduction caused by frost and heat stress during crop development. The function combines temperature-driven potential damage (piecewise linear response to minimum/maximum temperature) with growth-stage sensitivity to predict fractional yield loss from extreme temperature events. It was developed for wheat and canola through the GRDC Frost and Heat Management Analytics (FAHMA) project.
Extreme temperature events—both frost and heat—can significantly reduce crop yields, particularly when they occur during sensitive developmental stages such as flowering. The FrostHeatDamageFunctions model quantifies this impact by:
This function operates independently of the main yield prediction algorithms, calculating damage ratios (0–1, where 0 = no damage, 1 = complete yield loss) that can be applied to potential yield estimates. The model runs daily during the crop lifecycle, continuously monitoring temperature conditions and growth stage progression.
Key Applications: - Predicting frost-induced yield losses in wheat and canola - Assessing heat stress impacts during reproductive development - Evaluating combined frost and heat risks across growing seasons - Supporting agronomic decisions about variety selection and sowing dates
Biological Basis: Frost damage primarily affects reproductive organs through ice crystal formation, cell membrane disruption, and metabolic dysfunction. Heat stress impairs pollen viability, disrupts photosynthesis, and accelerates senescence. Both stresses cause proportionally greater damage when they coincide with critical developmental windows, particularly around flowering when reproductive structures are most vulnerable.
This section describes how this model is positioned within the APSIM framework. It outlines the broader structural and computational components that define its role and interactions in the simulation system.
This model inherits structural and functional behaviour from the following core APSIM components:
FrostHeatDamageFunctions inherits from the following base classes and interfaces:
This section describes how the model interacts with other components in the APSIM Next Generation framework.
These connections allow the model to exchange information—such as environmental conditions, developmental stage, or physiological responses—with other parts of the simulation system. For a general overview of how model components are connected in APSIM, see the Connections Overview.
| Component | Model | Connection Type | Description |
|---|---|---|---|
| Weather | Weather | Link | Provides daily minimum and maximum temperatures for damage calculations |
| Plant | Plant | Link (Parent) | Must be added as child of a Plant model; accesses phenology and grain organ |
| Phenology | Phenology | Child of Plant | Provides current growth stage for sensitivity calculations |
| Grain | ReproductiveOrgan | Child of Plant | Provides grain weight for final yield adjustment |
This section lists the key variables that describe or control the behaviour of this component. Some variables can be adjusted by the user to modify how the model behaves (configurable), while others are calculated internally and can be viewed as model outputs (reportable). For a general explanation of variable types and how they are used within the APSIM Next Generation framework, see the Model Variables Overview.
Configurable and Reportable Properties
The following properties must be configured when adding this function to a crop model:
| Property | Type | Description |
|---|---|---|
| CropType | Enum | Crop to simulate: Wheat or Canola (sets default parameters) |
| FrostLowTT | double | Lower temperature threshold for frost damage (°C) |
| FrostMaxReductionRatio | double | Maximum yield reduction at or below lower frost threshold (0–1) |
| FrostUpTT | double | Upper temperature threshold for frost damage (°C) |
| FrostMinReductionRatio | double | Minimum yield reduction at or above upper frost threshold (0–1) |
| FrostStartSensitiveGS | double | Growth stage when frost-sensitive period begins |
| FrostStartMostSensitiveGS | double | Growth stage when maximum frost sensitivity begins |
| FrostEndMostSensitiveGS | double | Growth stage when maximum frost sensitivity ends |
| FrostEndSensitiveGS | double | Growth stage when frost-sensitive period ends |
| HeatLowTT | double | Lower temperature threshold for heat damage (°C) |
| HeatMinReductionRatio | double | Minimum yield reduction at or below lower heat threshold (0–1) |
| HeatUpTT | double | Upper temperature threshold for heat damage (°C) |
| HeatMaxReductionRatio | double | Maximum yield reduction at or above upper heat threshold (0–1) |
| HeatStartSensitiveGS | double | Growth stage when heat-sensitive period begins |
| HeatStartMostSensitiveGS | double | Growth stage when maximum heat sensitivity begins |
| HeatEndMostSensitiveGS | double | Growth stage when maximum heat sensitivity ends |
| HeatEndSensitiveGS | double | Growth stage when heat-sensitive period ends |
Read-Only Reportable Properties
| Property | Type | Description |
|---|---|---|
| FrostPotentialReductionRatio | double | Daily potential yield reduction by frost based on temperature |
| FrostSensitivity | double | Daily sensitivity of yield to frost based on growth stage (0–1) |
| FrostReductionRatio | double | Daily actual yield reduction ratio by frost stress |
| HeatPotentialReductionRatio | double | Daily potential yield reduction by heat based on temperature |
| HeatSensitivity | double | Daily sensitivity of yield to heat based on growth stage (0–1) |
| HeatReductionRatio | double | Daily actual yield reduction ratio by heat stress |
| FrostHeatReductionRatio | double | Daily combined yield reduction ratio from frost and heat |
| CumulativeFrostReductionRatio | double | Cumulative yield reduction from all frost events |
| CumulativeHeatReductionRatio | double | Cumulative yield reduction from all heat events |
| CumulativeFrostHeatReductionRatio | double | Cumulative yield reduction from combined frost and heat |
| FrostEventNumber | double | Number of frost events during sensitive period |
| HeatEventNumber | double | Number of heat events during sensitive period |
| FrostHeatYield | double | Frost- and heat-limited yield (g/m²) |
| FrostSensitivePeriodStartDAS | double | Start of frost sensitive period (days after sowing) |
| FrostSensitivePeriodEndDAS | double | End of frost sensitive period (days after sowing) |
| HeatSensitivePeriodStartDAS | double | Start of heat sensitive period (days after sowing) |
| HeatSensitivePeriodEndDAS | double | End of heat sensitive period (days after sowing) |
Crop Selection: - CropType: Select either Wheat or Canola. This automatically loads crop-specific default parameters optimized for each crop.
Environmental Data (from Weather model): - Daily minimum temperature (°C) - for frost damage assessment - Daily maximum temperature (°C) - for heat damage assessment
Crop Development Data (from Plant model): - Current growth stage - determines sensitivity at each developmental phase - Grain weight - used to calculate final frost- and heat-limited yield
The following parameters define frost and heat damage responses. Default values are provided for wheat and canola based on field data calibration:
| Parameter (property) | Description | Wheat | Canola |
|---|---|---|---|
| FrostLowTT | Lower temperature threshold for frost damage (°C) | -4.00 | -4.11 |
| FrostMaxReductionRatio | Yield reduction ratio at the lower threshold (0–1, max reduction) | 0.40 | 0.31 |
| FrostUpTT | Upper temperature threshold for frost damage (°C) | 1.00 | -0.75 |
| FrostMinReductionRatio | Yield reduction ratio at the upper threshold (0–1, min reduction) | 0.00 | 0.00 |
| FrostStartSensitiveGS | Start of the frost-sensitive growth stage period (GS units) | 6.49 | 7.22 |
| FrostStartMostSensitiveGS | Start of the most-sensitive period (sensitivity = 1) (GS units) | 8.00 | 7.33 |
| FrostEndMostSensitiveGS | End of the most-sensitive period (sensitivity = 1) (GS units) | 9.50 | 8.06 |
| FrostEndSensitiveGS | End of the frost-sensitive growth stage period (GS units) | 9.50 | 8.18 |
| Parameter (property) | Description | Wheat | Canola |
|---|---|---|---|
| HeatLowTT | Lower temperature threshold for heat damage (°C) | 30.35 | 27.45 |
| HeatMinReductionRatio | Yield reduction ratio at the lower threshold (0–1, min reduction) | 0.00 | 0.00 |
| HeatUpTT | Upper temperature threshold for heat damage (°C) | 34.00 | 38.84 |
| HeatMaxReductionRatio | Yield reduction ratio at the upper threshold (0–1, max reduction) | 0.20 | 0.58 |
| HeatStartSensitiveGS | Start of the heat-sensitive growth stage period (GS units) | 7.28 | 5.58 |
| HeatStartMostSensitiveGS | Start of the most-sensitive period (sensitivity = 1) (GS units) | 7.48 | 6.26 |
| HeatEndMostSensitiveGS | End of the most-sensitive period (sensitivity = 1) (GS units) | 8.97 | 9.20 |
| HeatEndSensitiveGS | End of the heat-sensitive growth stage period (GS units) | 9.09 | 9.43 |
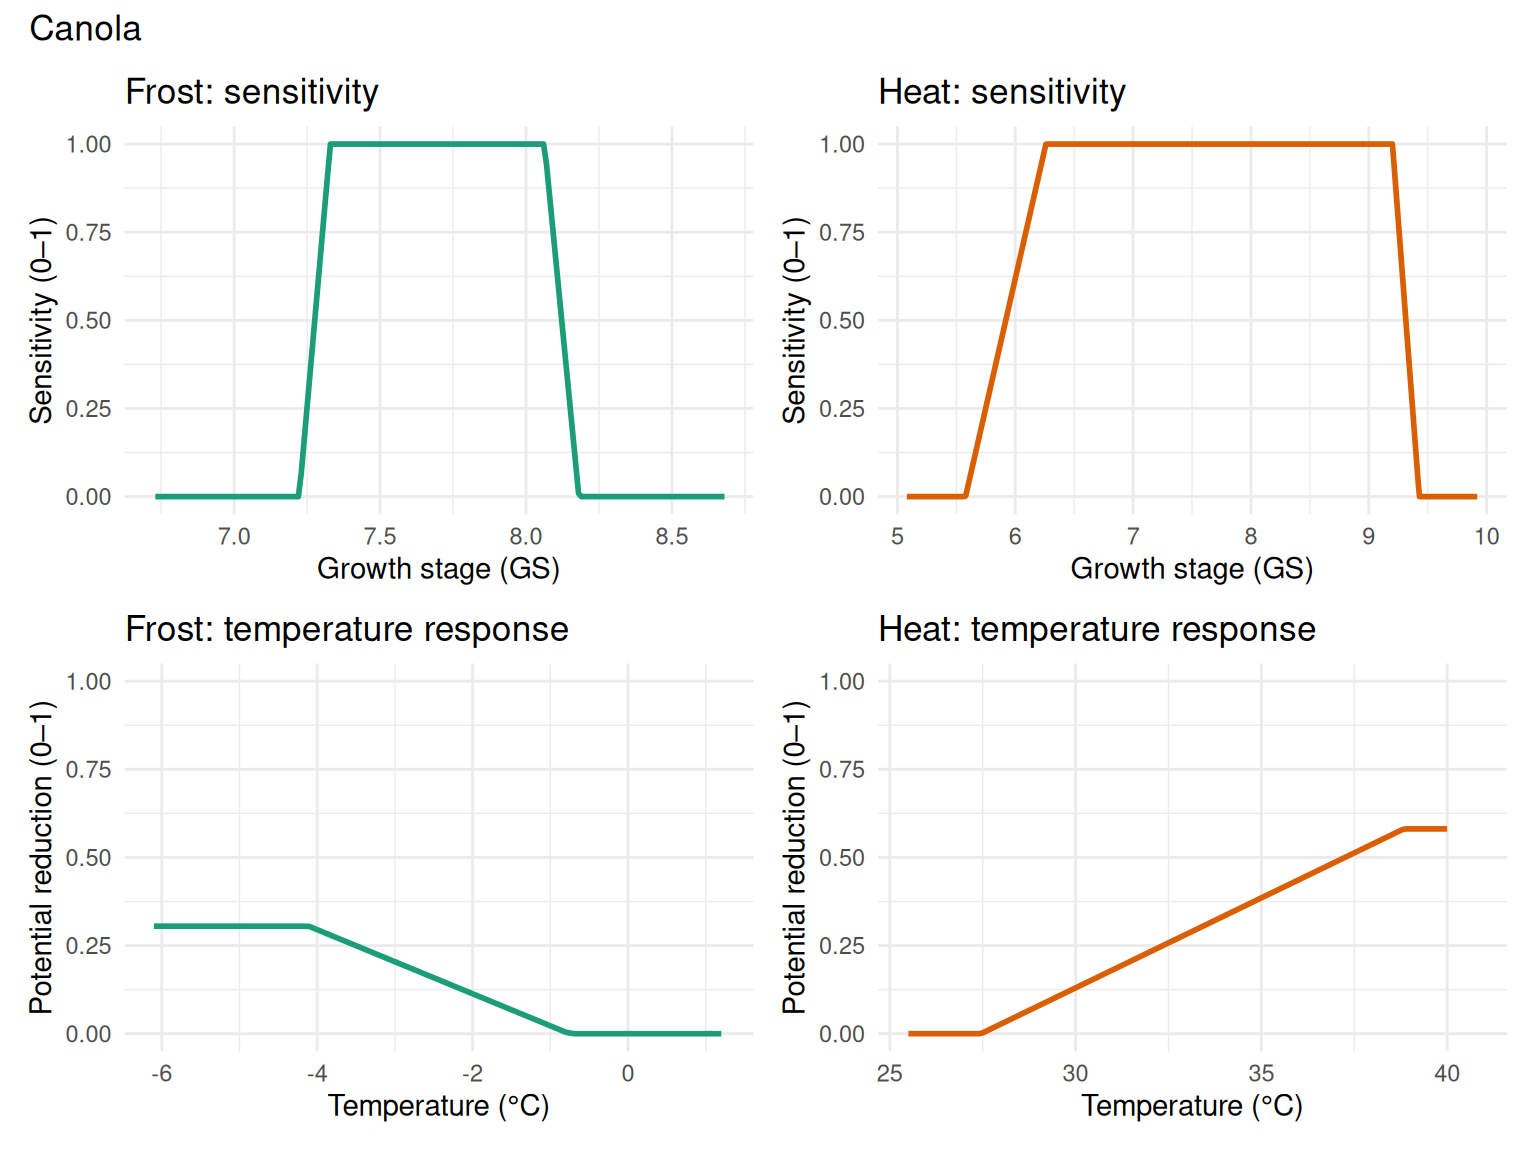
The figures below illustrate the temperature response and growth stage sensitivity functions for frost and heat damage for both wheat and canola crops using the default parameters.
Parameter Interpretation: - Reduction ratio: 0 = no yield loss, 1 = complete yield loss - Sensitivity: 0 = no sensitivity (no damage regardless of temperature), 1 = maximum sensitivity (full potential damage occurs) - Growth stages (GS): Decimal scale tracking crop development (e.g., 8.0 ≈ anthesis for wheat)
This section describes the scientific processes and algorithms represented by this component. Each process corresponds to a biological, physical, or chemical mechanism simulated during a model time step. Where appropriate, equations or conceptual summaries are provided to explain how the process operates within the APSIM Next Generation framework.
The FrostHeatDamageFunctions model operates through four main processes executed daily during crop growth:
At the Sowing event, all internal variables are reset to initial values:
Each day, potential yield reduction from frost and heat is calculated using piecewise linear functions of temperature.
Frost Potential Reduction (based on daily minimum temperature \(T_{min}\)):
\[ P_{frost}(T_{min}) = \begin{cases} R_{max,frost} & \text{if } T_{min} \leq T_{low,frost} \\ R_{max,frost} + \frac{(T_{min} - T_{low,frost}) \cdot (R_{min,frost} - R_{max,frost})}{T_{up,frost} - T_{low,frost}} & \text{if } T_{low,frost} < T_{min} < T_{up,frost} \\ R_{min,frost} & \text{if } T_{min} \geq T_{up,frost} \end{cases} \]
where: - \(T_{low,frost}\) = FrostLowTT (lower temperature threshold) - \(T_{up,frost}\) = FrostUpTT (upper temperature threshold) - \(R_{max,frost}\) = FrostMaxReductionRatio (maximum reduction) - \(R_{min,frost}\) = FrostMinReductionRatio (minimum reduction)
Heat Potential Reduction (based on daily maximum temperature \(T_{max}\)):
\[ P_{heat}(T_{max}) = \begin{cases} R_{min,heat} & \text{if } T_{max} \leq T_{low,heat} \\ R_{min,heat} + \frac{(T_{max} - T_{low,heat}) \cdot (R_{max,heat} - R_{min,heat})}{T_{up,heat} - T_{low,heat}} & \text{if } T_{low,heat} < T_{max} < T_{up,heat} \\ R_{max,heat} & \text{if } T_{max} \geq T_{up,heat} \end{cases} \]
Sensitivity to damage varies with crop development stage. The function uses a trapezoidal shape with four growth stage thresholds:
Frost Sensitivity (based on current growth stage \(GS\)):
\[ S_{frost}(GS) = \begin{cases} 0 & \text{if } GS \leq GS_{start,frost} \\ \frac{GS - GS_{start,frost}}{GS_{peak\_start,frost} - GS_{start,frost}} & \text{if } GS_{start,frost} < GS < GS_{peak\_start,frost} \\ 1 & \text{if } GS_{peak\_start,frost} \leq GS \leq GS_{peak\_end,frost} \\ \frac{GS_{end,frost} - GS}{GS_{end,frost} - GS_{peak\_end,frost}} & \text{if } GS_{peak\_end,frost} < GS < GS_{end,frost} \\ 0 & \text{if } GS \geq GS_{end,frost} \end{cases} \]
The same trapezoidal structure applies to heat sensitivity with heat-specific thresholds.
Daily actual reduction is the product of potential reduction and sensitivity:
\[ R_{frost,daily} = P_{frost}(T_{min}) \times S_{frost}(GS) \]
\[ R_{heat,daily} = P_{heat}(T_{max}) \times S_{heat}(GS) \]
Combined daily reduction accounts for both stresses:
\[ R_{combined,daily} = 1 - (1 - R_{frost,daily}) \times (1 - R_{heat,daily}) \]
Cumulative reduction uses multiplicative accumulation to day \(t\):
\[ R_{frost,cum}(t) = 1 - \prod_{i=1}^{t} (1 - R_{frost,daily}(i)) \]
\[ R_{heat,cum}(t) = 1 - \prod_{i=1}^{t} (1 - R_{heat,daily}(i)) \]
\[ R_{combined,cum}(t) = 1 - (1 - R_{frost,cum}(t)) \times (1 - R_{heat,cum}(t)) \]
Final frost- and heat-limited yield:
\[ Y_{frost\_heat} = Y_{potential} \times (1 - R_{combined,cum}) \]
where \(Y_{potential}\) is the grain weight simulated by the crop model without considering frost/heat damage. s.
Read-Only Reportable Properties
All calculated daily and cumulative variables listed in the Model Variables section can be reported for analysis, including: - Daily potential reductions, sensitivities, and actual reductions - Cumulative reduction ratios and event counts - Sensitive period timing - Final frost- and heat-limited yield
FrostHeatDamageFunctions must be added as a child of a Plant model (Wheat or Canola) in the simulation tree:
CropType property to match your cropImportant: This function must be a direct child of the Plant model it is parameterized for. It will raise an error if linked to a different plant.
Consider a wheat crop experiencing two frost events during the critical anthesis period:
Using the default wheat parameters from the table above, we can calculate the frost damage step by step.
For each day, we calculate the potential reduction using the frost temperature response function:
Day 1 (T_min = -1°C): - Since -1°C is between FrostLowTT (-4°C) and FrostUpTT (1°C), we use linear interpolation: - \(P_{frost}(-1) = 0.40 + (-1 - (-4)) \times \frac{(0.00 - 0.40)}{(1 - (-4))} = 0.40 + 3 \times \frac{-0.40}{5} = 0.40 - 0.24 = 0.16\)
Day 2 (T_min = -2°C): - \(P_{frost}(-2) = 0.40 + (-2 - (-4)) \times \frac{(0.00 - 0.40)}{(1 - (-4))} = 0.40 + 2 \times \frac{-0.40}{5} = 0.40 - 0.16 = 0.24\)
For both days, we calculate sensitivity using the frost sensitivity function:
Day 1 (GS = 8.0): - GS 8.0 is between FrostStartMostSensitiveGS (8.0) and FrostEndMostSensitiveGS (9.5) - Therefore: \(S_{frost}(8.0) = 1.0\) (maximum sensitivity)
Day 2 (GS = 8.2): - GS 8.2 is also between 8.0 and 9.5 - Therefore: \(S_{frost}(8.2) = 1.0\) (maximum sensitivity)
Day 1: \(R_{frost}(1) = P_{frost}(-1) \times S_{frost}(8.0) = 0.16 \times 1.0 = 0.16\) (16% yield loss)
Day 2: \(R_{frost}(2) = P_{frost}(-2) \times S_{frost}(8.2) = 0.24 \times 1.0 = 0.24\) (24% yield loss)
The cumulative frost reduction after both events is:
\[R_{frost,\ cum}(2) = 1 - \prod_{i=1}^{2} (1 - R_{frost}(i))\]
\[R_{frost,\ cum}(2) = 1 - [(1 - 0.16) \times (1 - 0.24)]\]
\[R_{frost,\ cum}(2) = 1 - [0.84 \times 0.76] = 1 - 0.6384 = 0.3616\]
If the potential wheat yield was 5000 kg/ha (500 g/m²), the frost-limited yield would be:
\[Y_{frost} = Y \times (1 - R_{frost,\ cum}) = 500 \times (1 - 0.3616) = 500 \times 0.6384 = 319.2 \text{ g/m²}\]
Result: The two frost events result in a cumulative yield loss of 36.2%, reducing the potential yield from 5000 kg/ha to 3192 kg/ha.
This example demonstrates how: