CO2
CO2 is a key factor in plant growth and development, influencing various physiological processes. In APSIM NG, CO2 effects can be modeled to simulate its impact on radiation use efficiency (RUE), stomatal conductance, and critical nitrogen concentration.
The default CO2 concentration in APSIM NG is set to 350 ppm, but it can be adjusted to simulate different atmospheric conditions with manager script.
Radiation Use Efficiency (RUE)
C3
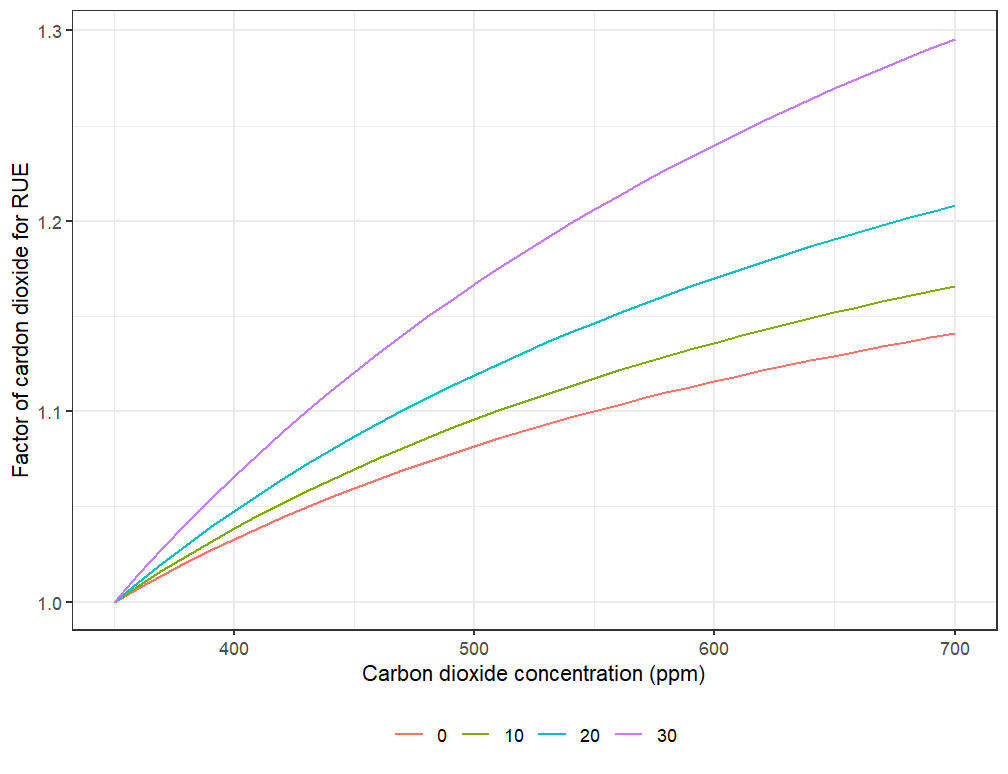
For C3 plants (like wheat), Radiation Use Efficiency is scaled by the \(CO_{\text{2}}\) factor which is calculated by a function of environmental \(CO_{\text{2}}\) concentration (\(C\), ppm) and daily mean temperature (\(T_{mean}\)) as published by (Reyenga et al. 1999).
\[ f_{c}=\frac{(C-C_{i})(350+2C_{i})}{(C+2C_{i})(350-C_{i})} \]
where \(C_{i}\) is the temperature dependent \(CO_{\text{2}}\) compensation point (ppm) and is derived from the following function.
\[ C_{i}=\frac{163-T_{mean}}{5-0.1T_{mean}} \]
C4
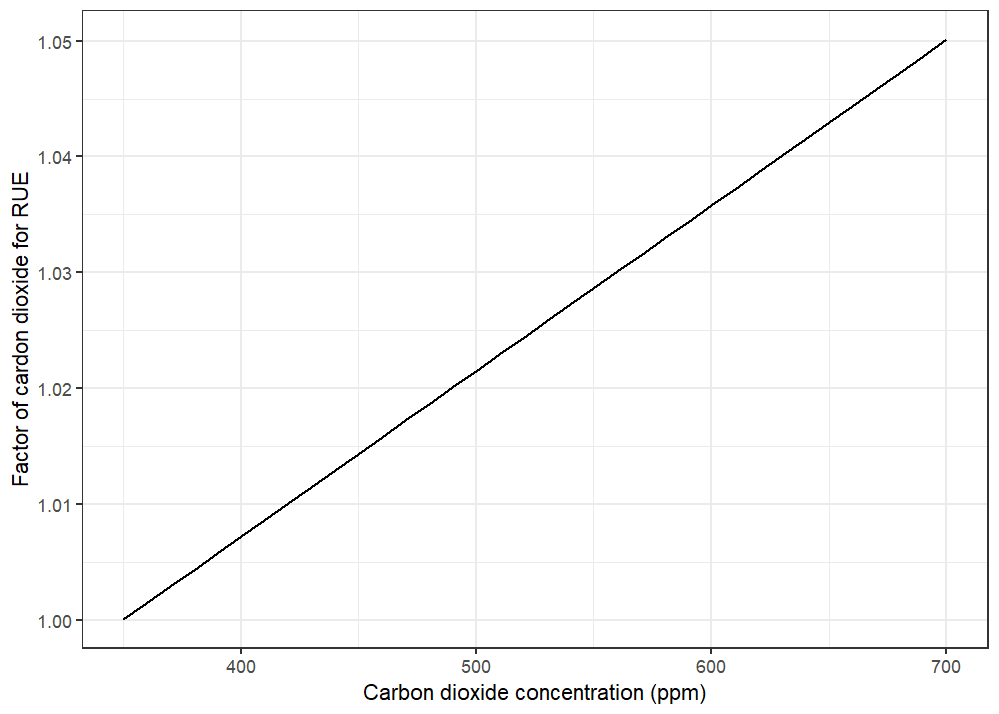
For C4 crops (e.g. Rice), Radiation Use Efficiency is increasing with CO2 concentration (\(C\), ppm) with a factor (\(f_{c}\)) according personal communications with Mark Howden.
\[ f_{c}=0.000143 \times C + 0.95 \]
Critical Nitrogen Concentration
In APSIM NG, the Critical Nitrogen Concentration in Leaf is modified by CO,,2,, concentration.
Stomatal Conductance
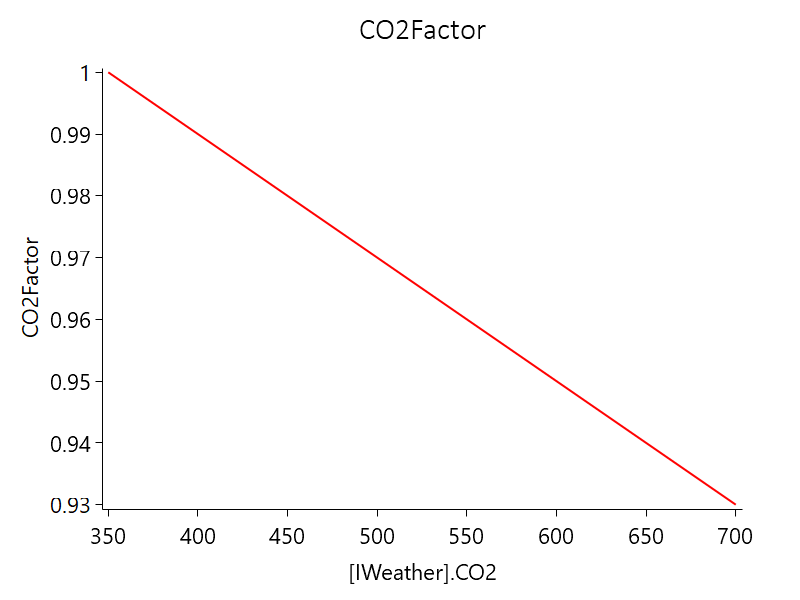
The APSIM model considers a reduction in Stomatal Conductance with increasing CO2 levels and its interaction with enhanced RUE|CO2 for RUE of C3. The Stomatal Conductance reduction is likely to reduce water loss but maintain photosynthesis due to higher water potential and internal CO2 levels, resulting in an increased transpiration efficiency (Reyenga et al. 1999). The response Stomatal Conductance of to increased CO2 concentration is calculated as follows (Elli et al. 2020).
\[ SC = f_{c} / (\frac {CO2 - C_{i}} {350 - C_{i}}) \]
where \[C_{i}\] temperature-dependent CO2 compensation point, which is calculated by:
\[ C_{i}=\frac{163-T_{mean}}{5-0.1T_{mean}} \]