ColdVrnResponse
A temperature-responsive function in APSIM Next Generation that calculates the upregulation of the Vrn1 vernalisation gene in response to cold temperatures. This function quantifies how cold exposure enhances vernalisation in cereal crops, enabling the model to simulate accelerated development in response to chilling conditions.
Overview
The ColdVrnResponse function calculates the additional contribution to Vrn1 gene expression resulting from exposure to low temperatures, as described in Brown et al. (2013). This represents the cold-induced acceleration of vernalisation that allows plants to progress through their vernalisation requirement more rapidly under chilling conditions.
The function uses a temperature-dependent exponential response where Vrn1 expression increases as temperatures decline below optimal growing conditions. When temperatures exceed a de-vernalisation threshold, the response is reduced or suppressed to mimic the loss of vernalisation memory at warm temperatures. This mechanism is essential for accurately modeling development timing in cold-requiring cultivars across varying thermal environments.
The function implements both IFunction and IIndexedFunction interfaces and operates within the CAMP phenology framework.
Model Structure
This section describes how this model is positioned within the APSIM framework. It outlines the broader structural and computational components that define its role and interactions in the simulation system.
This model inherits structural and functional behaviour from the following core APSIM components:
Connections to Other Components
This section describes how the model interacts with other components in the APSIM Next Generation framework.
These connections allow the model to exchange information—such as environmental conditions, developmental stage, or physiological responses—with other parts of the simulation system. For a general overview of how model components are connected in APSIM, see the Connections Overview.
| Component | Model | Connection Type | Description |
|---|---|---|---|
| CAMP | CAMP | Link, Ancestor By Name | Parent CAMP model providing context and parameters. |
| k | IFunction | Link, Child By Name | Exponential shape factor for temperature response. |
| deVernalisationTemp | IFunction | Link, Child By Name | Temperature threshold for de-vernalisation. |
| deVernalisationRate | IFunction | Link, Child By Name | Rate of Vrn1 down-regulation above threshold. |
Model Variables
This section lists the key variables that describe or control the behaviour of this component. Some variables can be adjusted by the user to modify how the model behaves (configurable), while others are calculated internally and can be viewed as model outputs (reportable). For a general explanation of variable types and how they are used within the APSIM Next Generation framework, see the Model Variables Overview.
Configurable and Reportable Properties
| Property | Type | Description |
|---|---|---|
| k | IFunction | Exponential shape factor for cold temperature response. |
| deVernalisationTemp | IFunction | Temperature above which de-vernalisation occurs. |
| deVernalisationRate | IFunction | Rate of Vrn1 downregulation above the temperature threshold. |
Read-Only Reportable Properties
No read-only properties are available for this function.
Processes and Algorithms
This section describes the scientific processes and algorithms represented by this component. Each process corresponds to a biological, physical, or chemical mechanism simulated during a model time step. Where appropriate, equations or conceptual summaries are provided to explain how the process operates within the APSIM Next Generation framework.
Cold-Induced Vrn1 Upregulation
The function computes the Vrn1 upregulation for a given temperature \(T\) (typically sub-daily temperature). The calculation depends on whether the temperature is below or above the de-vernalisation threshold.
Below De-vernalisation Threshold
If temperature \(T\) is less than the de-vernalisation temperature \(T_{\text{devernalisation}}\), Vrn1 expression follows an exponential function of temperature. The result is divided by 24 to convert from a daily to hourly rate, as hourly temperature interpolation is used in the model:
\[ \Delta Vrn1_{T} = \frac{e^{k \cdot T} }{24} \]
Where:
- \(\Delta Vrn1_{T}\) is the upregulation of Vrn1 from cold at temperature \(T\),
- \(k\) is the exponential shape factor for cold temperature response (typically -0.17),
- \(T\) is the temperature in degrees Celsius.
Above De-vernalisation Threshold
If temperature \(T\) exceeds the de-vernalisation threshold \(T_{\text{devernalisation}}\), the response is determined by the de-vernalisation rate parameter. The result is divided by 24 to convert from a daily to hourly rate:
\[ \Delta Vrn1_{T} = \frac{R_{\text{devernalisation}}}{24} \]
Where:
- \(R_{\text{devernalisation}}\) is the de-vernalisation rate parameter (often set to 0 to prevent de-vernalisation).
The function returns 0 if the CAMP model parameters have not been initialized (camp.Params == null).
User Interface
ColdVrnResponse can be added as a child of an IFunction node in the model tree. Right-click the parent function node, select “Add Model…”, and search for ColdVrnResponse in the Filter Box.
Practical Example
In the wheat CAMP model or LeavesInitiating phase, the following parameters are used for the ColdVrnResponse function:
| Name | Description | Value |
|---|---|---|
| k | Exponential shape factor for cold temperature response. | -0.17 |
| deVernalisationTemp | Temperature above which de-vernalisation occurs. | 20 °C |
| deVernalisationRate | Rate of Vrn1 downregulation above the temperature threshold. | 0 |
The deVernalisationRate is set to 0, indicating that there is no down-regulation of Vrn1 expression at temperatures above the de-vernalisation threshold (20°C). This means vernalisation is preserved once acquired, even under warm conditions.
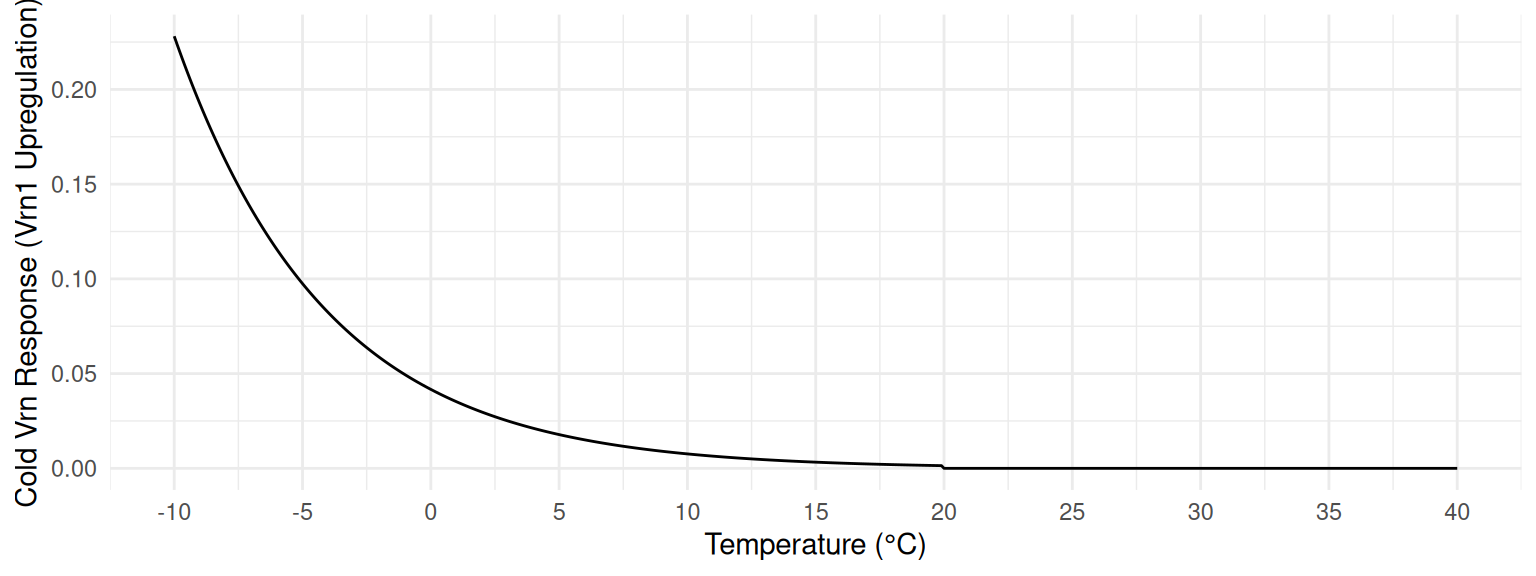
The upregulation of Vrn1 from cold at temperature \(T\) (\(\Delta Vrn1_{T}\)) is shown in the following plot:
The plot shows that cold Vrn1 upregulation increases exponentially as temperature decreases below 20°C, with maximum response occurring at the coldest temperatures. Above 20°C, the response drops to zero.
See Also
- Source code: ColdVrnResponse.cs on GitHub
- Related models:
References
Brown, Hamish E., Peter D. Jamieson, Ian R. Brooking, Derrick J. Moot, and Neil I. Huth. 2013. “Integration of Molecular and Physiological Models to Explain Time of Anthesis in Wheat.” Annals of Botany 112 (9): 1683–703. https://doi.org/10.1093/aob/mct224.