EventNamesOnGraph
A graphical annotation model that displays event names (such as phenological growth stages) as vertical reference lines with labels on graph series in APSIM NG.
Overview
EventNamesOnGraph is designed to add event names (e.g., growth stages) as text annotations to a Graph Series in APSIM NG. This model is particularly useful for visualizing the timing of key events in a crop’s growth cycle, such as sowing, emergence, flowering, and harvest. It creates vertical dotted lines at the time points when events occur and labels them with the event names, helping researchers identify critical developmental stages in relation to other simulated variables.
The model reads event data from a specified column in the simulation output and automatically places annotations at corresponding x-axis positions on the graph.
Model Structure
This section describes how this model is positioned within the APSIM framework. It outlines the broader structural and computational components that define its role and interactions in the simulation system.
This model inherits structural and functional behaviour from the following core APSIM components:
- Model
- ICachableGraphable
- IStructureDependency
Connections to Other Components
This section describes how the model interacts with other components in the APSIM Next Generation framework.
These connections allow the model to exchange information—such as environmental conditions, developmental stage, or physiological responses—with other parts of the simulation system. For a general overview of how model components are connected in APSIM, see the Connections Overview.
| Component | Model | Connection Type | Description |
|---|---|---|---|
| Series | Series | Parent | The parent series that defines the data table and x-axis variable for annotation placement. |
| DataStore | IDataStore | Link | Provides access to simulation output data for reading event names and timing. |
Model Variables
This section lists the key variables that describe or control the behaviour of this component. Some variables can be adjusted by the user to modify how the model behaves (configurable), while others are calculated internally and can be viewed as model outputs (reportable). For a general explanation of variable types and how they are used within the APSIM Next Generation framework, see the Model Variables Overview.
Configurable and Reportable Properties
| Property | Type | Description |
|---|---|---|
| ColumnName | string | The name of the column containing event names to display on the graph (e.g., Wheat.Phenology.CurrentStageName). |
| SimulationName | string | The name of the simulation to plot. If specified, only data from this simulation will be used for annotations. |
Read-Only Reportable Properties
No read-only properties are available for this model.
Processes and Algorithms
This section describes the scientific processes and algorithms represented by this component. Each process corresponds to a biological, physical, or chemical mechanism simulated during a model time step. Where appropriate, equations or conceptual summaries are provided to explain how the process operates within the APSIM Next Generation framework.
Annotation Generation
The model implements the GetAnnotations() method which performs the following steps:
Data Retrieval: Obtains the data view from the parent series definition, using the specified simulation name if provided.
Column Identification: Locates the phenology stage column in the data table by searching for column names that contain the specified
ColumnNamevalue.X-Axis Value Extraction: Extracts x-axis values from the data table, handling different data types (DateTime, int, or double) as appropriate.
Annotation Creation: For each event name in the data:
- Creates a vertical dotted line (
LineAnnotation) spanning the full height of the graph (fromdouble.MinValuetodouble.MaxValue) - Creates a text label (
TextAnnotation) at the bottom of the graph, rotated 270 degrees for vertical display - Skips empty or “?” values to avoid cluttering the graph
- Creates a vertical dotted line (
The annotations are color-coded in black and positioned at the x-axis values corresponding to when each event occurred in the simulation.
User Interface
EventNamesOnGraph can be added as a child of a Series node in the model tree. Right-click the Series node, select “Add Model…”, and search for EventNamesOnGraph in the Filter Box.
After adding the model: - Set the ColumnName property to the column containing event names (e.g., Wheat.Phenology.CurrentStageName) - Optionally set the SimulationName to filter data from a specific simulation
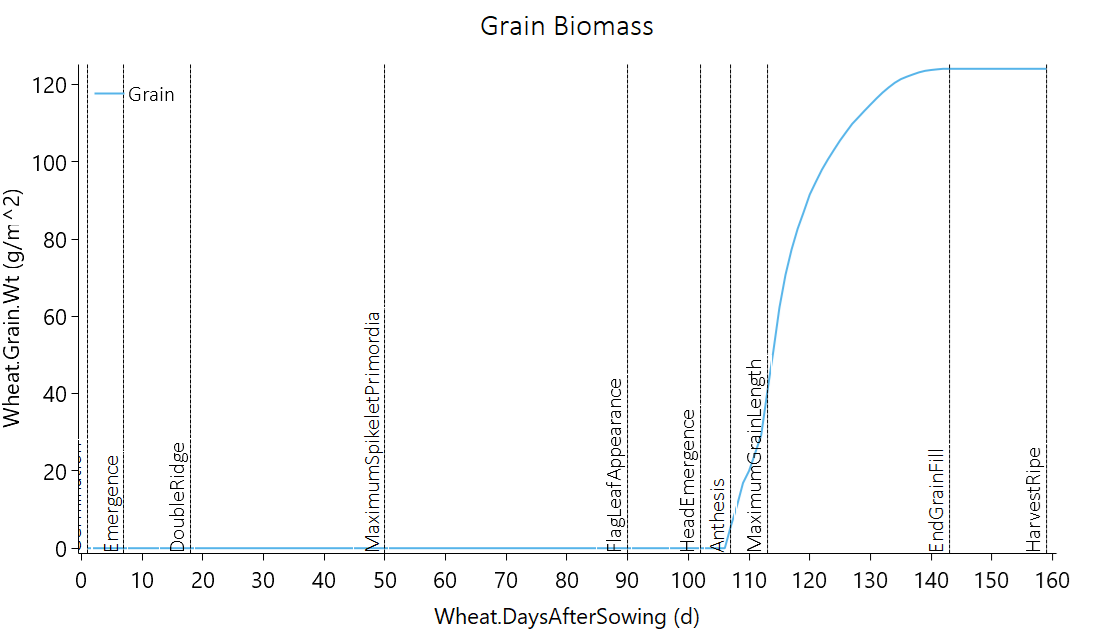
Practical Example
To display event names (such as growth stages) on a graph, follow these steps after running your APSIM simulation:
- Create a new model
Graphin the simulation tree. - Add a new model
Seriesto theGraphand configure it as your desired output (e.g., x-axis asWheat.Phenology.DaysAfterSowing; y-axis asWheat.Grain.Wt). - Add a new model
EventNamesOnGraphto theSeriesand select the column name to plot, e.g.,Wheat.Phenology.CurrentStageName.
See Also
- Source code: EventNamesOnGraph.cs on GitHub