Thermal Time
Thermal time (also called growing degree days) is the primary driver of phenological development in the Oats model. It determines the rate of developmental progress through crop’s phases and is used by organs to determine potential growth rates.
Overview
Biological role: Thermal time quantifies the accumulated heat exposure experienced by the crop, translating calendar time into physiological time based on temperature. It represents the effective temperature for plant development above a base temperature.
Placement in crop system: Thermal time is calculated daily within the Phenology component and serves as the fundamental progression driver for all phenological phases (Germinating, Emerging, Vegetative, Reproductive, Grain Filling) and many organ growth processes.
Importance for agronomy or breeding: Thermal time allows prediction of crop development stages under varying temperature regimes, enabling better crop management decisions (sowing dates, irrigation timing, harvest scheduling) and breeding selection for different thermal environments.
Environmental sensitivities:
- Temperature: Primary driver - responds to air temperature with three cardinal temperatures defining the response curve
- Diurnal temperature variation: Captured through sub-daily interpolation to account for temperature fluctuations throughout the day with three-hourly interpolation method
Component Interaction Map
- Inputs:
- Daily maximum air temperature (from Weather)
- Daily minimum air temperature (from Weather)
- Outputs:
- Daily thermal time (°Cd) - used by all phenology phases
Methodology
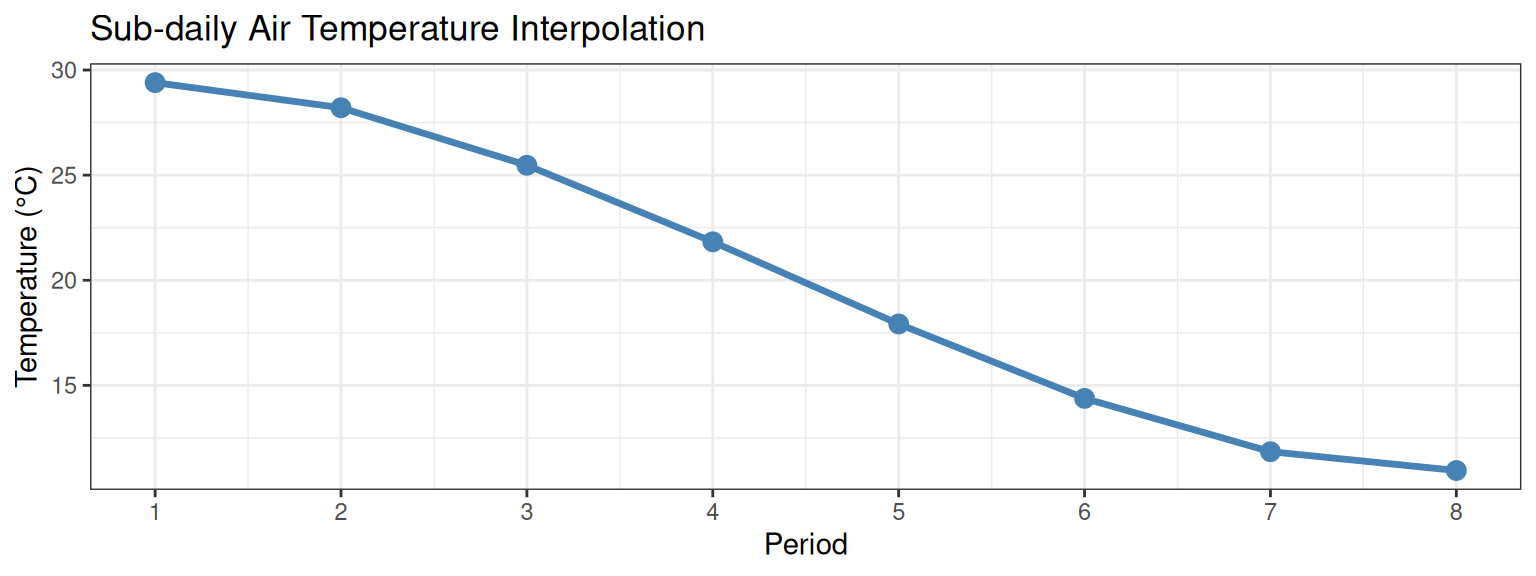
Interpolation of sub-daily temperature
The daily minimum and maximum air temperatures are used to calculate thermal time using sub-daily interpolation with three-hourly intervals.
Three-hourly Thermal Time
Key biological assumptions
- Plant development rate increases linearly with temperature between base (0°C) and optimum (30°C) temperatures
- Development ceases below the base temperature (0°C) and above a maximum temperature (40°C)
- Development rate declines linearly between optimum and maximum temperatures
- Diurnal temperature variation affects development - captured through sub-daily interpolation rather than simple daily mean temperature
- The same thermal time response applies across all developmental phases (no phase-specific temperature responses)
Mathematical representation:
At each three-hour interval, the air temperature is converted to thermal time using the prescribed temperature response curve through linear interpolation between points:
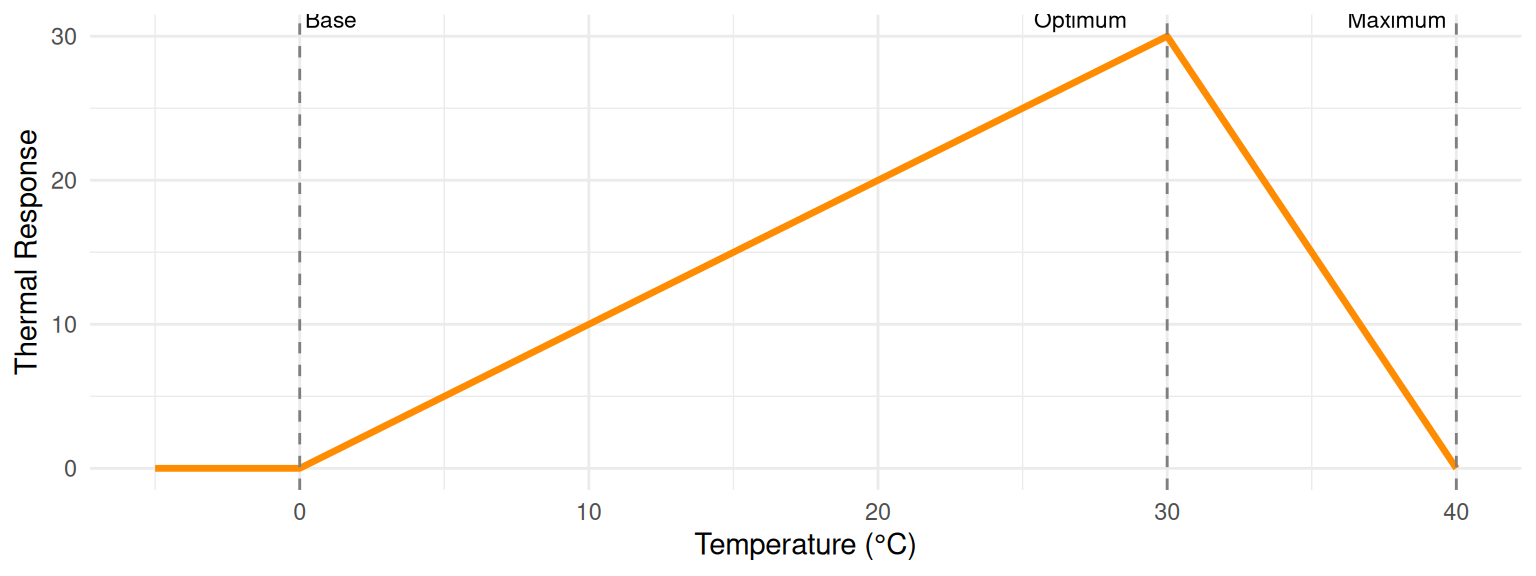
The thermal time response to air temperature (\(T\)) follows a three-cardinal-temperature model (0°C (base), 30°C (optimum), and 40°C (maximum)):
\[ TT_{i} = \begin{cases} 0 & \text{if } T \leq 0°C \\ T & \text{if } 0°C < T \leq 30°C \\ 30 - \frac{30}{40 - 30}(T - 30) & \text{if } 30°C < T \leq 40°C \\ 0 & \text{if } T > 40°C \end{cases} \]
Where \(TT_{i}\) is the thermal time (°Cd) at temperature \(T\) (°C).
Daily Thermal Time
Daily thermal time is calculated using sub-daily interpolation with three-hourly thermal time values. Air temperature is interpolated from daily maximum and minimum using the three-hourly air temperature interpolation method, and the thermal time response is applied at each three-hour interval, then aggregated to give the daily total:
\[ TT_{\text{daily}} = \frac{1}{8} \sum_{i=1}^{8} TT_{t}(T_{i}) \]
where \(T_i\) represents the interpolated temperature at each three-hour interval.
Cultivar-Specific Parameters
The thermal time calculation itself has no cultivar-specific parameters - the temperature response is fixed for all Oats genotypes.
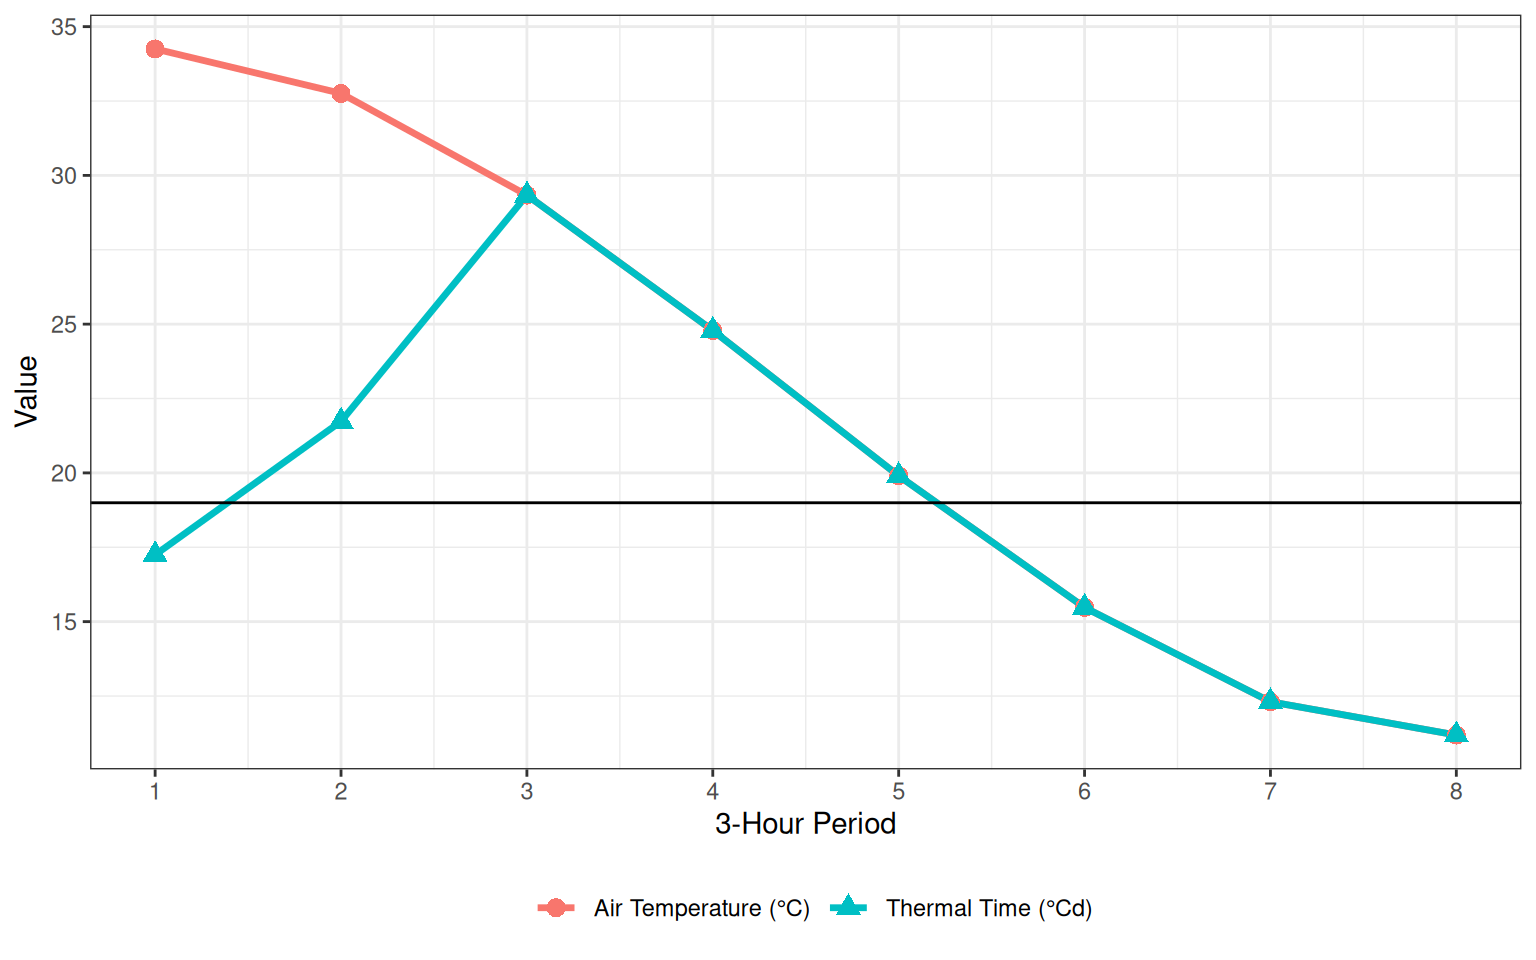
Practical Example
For a day with:
- Maximum temperature: 35°C
- Minimum temperature: 10°C
Three hourly air temperatures are interpolated using three-hourly interpolation. Then three hourly thermal time values are calculated using the defined temperature response curve.
| 3-Hour Period | Temperature (°C) | Thermal Time (°Cd) |
|---|---|---|
| 1 | 34.3 | 17.2 |
| 2 | 32.8 | 21.7 |
| 3 | 29.3 | 29.3 |
| 4 | 24.8 | 24.8 |
| 5 | 19.9 | 19.9 |
| 6 | 15.5 | 15.5 |
| 7 | 12.3 | 12.3 |
| 8 | 11.2 | 11.2 |
Finally, the daily thermal time is the average of the eight three-hourly thermal time values (i.e. 19 °Cd).
See Also
- SubDailyInterpolation Function
- ThreeHourAirTemperature Function
- Phenology Overview